Authored by Emeli Dral and Elena Samuylova, creators of Evidently (GitHub), an open-source ML and LLM evaluation framework with 25M+ downloads.
![]()
This is the fifth of five chapters.
Together with this theoretical introduction, you can explore a practical Python example on different LLM evaluation methods.
Production monitoring and observability
Deploying a generative system into production is an exciting milestone — but it’s only the beginning. Once the system is live, you need to monitor its performance continuously to ensure it remains accurate, efficient, and aligned with user needs. Production monitoring and observability help you track behavior, detect issues early, and maintain a high-quality user experience.
LLM monitoring vs. observability
Although often used interchangeably, monitoring and observability serve distinct but complementary roles.
- Monitoring involves tracking key system metrics and setting up alerts for failures or anomalies. It helps warn you when something is off — for instance, rising error rates or increasing latency.
- Observability goes deeper. It helps you understand why something is happening by collecting and analyzing detailed data like logs, traces, and internal metrics. If monitoring alerts you to a problem, observability helps you trace it to the root cause — such as slow search or an overloaded server.
Together, they create a complete picture:
- Monitoring detects symptoms — for instance, slow response times.
- Observability helps diagnose them — such as identifying a bottleneck in the retrieval step.
In production, both are necessary. Real-world usage introduces unexpected inputs and behaviors, making it essential to be able to perform continuous analysis.
What to monitor
Observability can happen at multiple levels, including infrastructure, system inputs and outputs.
1. System health
Before evaluating system outputs, ensure the underlying infrastructure is healthy. No matter how good the LLM and prompt is, it won’t deliver value if the infrastructure is unreliable. Monitor metrics such as:
- Latency and response time
- Error rates
- Resource usage (e.g., CPU, memory, GPU)
Standard application monitoring tools typically handle these effectively.
2. Input quality
Many LLM issues start with problematic inputs, especially in pipeline setups where upstream systems generate the input. Depending on your case, monitor for:
- Missing or empty fields
- Incorrect formats (e.g., numbers instead of text)
- Data quality, like type mismatches
Validating the quality of incoming data improves response accuracy and helps avoid silent failures.
3. LLM output quality
This is where online LLM evaluations come into picture. Once your system is running, you’ll want to assess the quality and relevance of the generated outputs continuously. Even the most thorough pre-launch testing can’t prepare you for every unique query or unexpected behavior.
Some examples of things you can track:
- Relevance: Are all answers on-topic?
- Response length: Are they too short or unnecessarily long?
- Refusals: How often does the model decline to answer?
- User frustration: Are users expressing confusion or dissatisfaction?
Even without ground truth references, you can evaluate output quality using automated methods. Online evaluations can also help surface product insights — such as frequently asked questions, user scenarios and gaps in your knowledge base — which can guide product iteration.
How to set up observability
A robust monitoring and evaluation process combines several components. Here’s how to build it:
Start with logging and tracing
Two foundational tools for observability are logging and tracing. These allow you to record and understand your system’s behavior during real-world use.
- Logging acts like a diary for your AI system. It captures user inputs, the LLM’s responses, and any errors. For instance, a support chatbot might log every query and its answer. These logs help verify whether the model’s responses are accurate, relevant, and aligned with expectations.
- Tracing gives a behind-the-scenes view of how tasks are processed. If logging tells you what happened, tracing tells you how. It tracks the internal steps in the pipeline — for example, showing whether a delay occurred during retrieval, generation, or another stage. This helps diagnose and resolve performance bottlenecks.
Together, logs and traces provide critical insight into system behavior and performance issues.
Configure evaluations
Once logs are collected, you can review them manually. But to scale evaluation, it’s essential to automate it. This involves regularly scoring the quality of model outputs based on pre-defined criteria.
You can schedule these evaluations continuously (as new logs come in) or in batches (e.g., hourly or daily jobs). Evaluations can apply to individual input-output pairs or be conducted at the session level, where you assess full interactions end-to-end.
Since you don’t have “correct” answers in live settings, you’ll use reference-free evaluation methods:
- LLM-as-a-Judge: Using LLMs to score responses for quality, helpfulness, tone, etc.
- Model-based scoring: Pretrained models for detecting sentiment, toxicity, or bias.
- Semantic similarity: Measuring closeness between the output and query or retrieved context.
- Regex and format checks: Validating structure (e.g., proper JSON).
- Text statistics: Measuring things like length or word presence.
Build a dashboard
Dashboards offer near real-time overview of your system’s performance. A good dashboard helps both technical and product teams stay aligned.
Dashboards can display:
- Any relevant output quality metrics (e.g., relevance, groundedness, JSON validity etc.)
- Volume statistics (e.g., number of queries handled)
- Result of human review (e.g. summary of labels from manual spot checks)
- User feedback (if available)
In addition to system quality metrics, dashboards can show business KPIs that reflect real-world impact. These vary by use case. For example, if you have an AI-powered support chatbot, you can track metrics like time to resolution, deflection rates, or user satisfaction scores.
It’s important to collaborate with business stakeholders to define the most relevant KPIs for your product goals.
Set up alerts
Dashboards are great, but you won’t be watching them 24/7. Alerts help you stay responsive to issues by notifying you when something goes wrong.
You can configure alerts to trigger immediately, or set rules based on patterns over time. Example use cases include:
- Error rates exceed a certain threshold
- Sudden increase in response time
- Drop in relevance or quality metrics over last hour
- Spikes in user-reported dissatisfaction
This gives you an early warning system so that you can intervene on time.
Evaluation feedback loop
Monitoring and evaluation are not just for detecting issues — they form the foundation for continuous improvement. A robust evaluation loop becomes a flywheel that drives AI product evolution at every stage, from your first prompt experiments to large-scale deployment.
You need LLM evaluations throughout the system lifecycle, and these workflows build on each other. Early-stage testing reveals basic failures; production monitoring surfaces real-world issues. Feeding learnings from one stage into the next is what makes the system smarter over time.
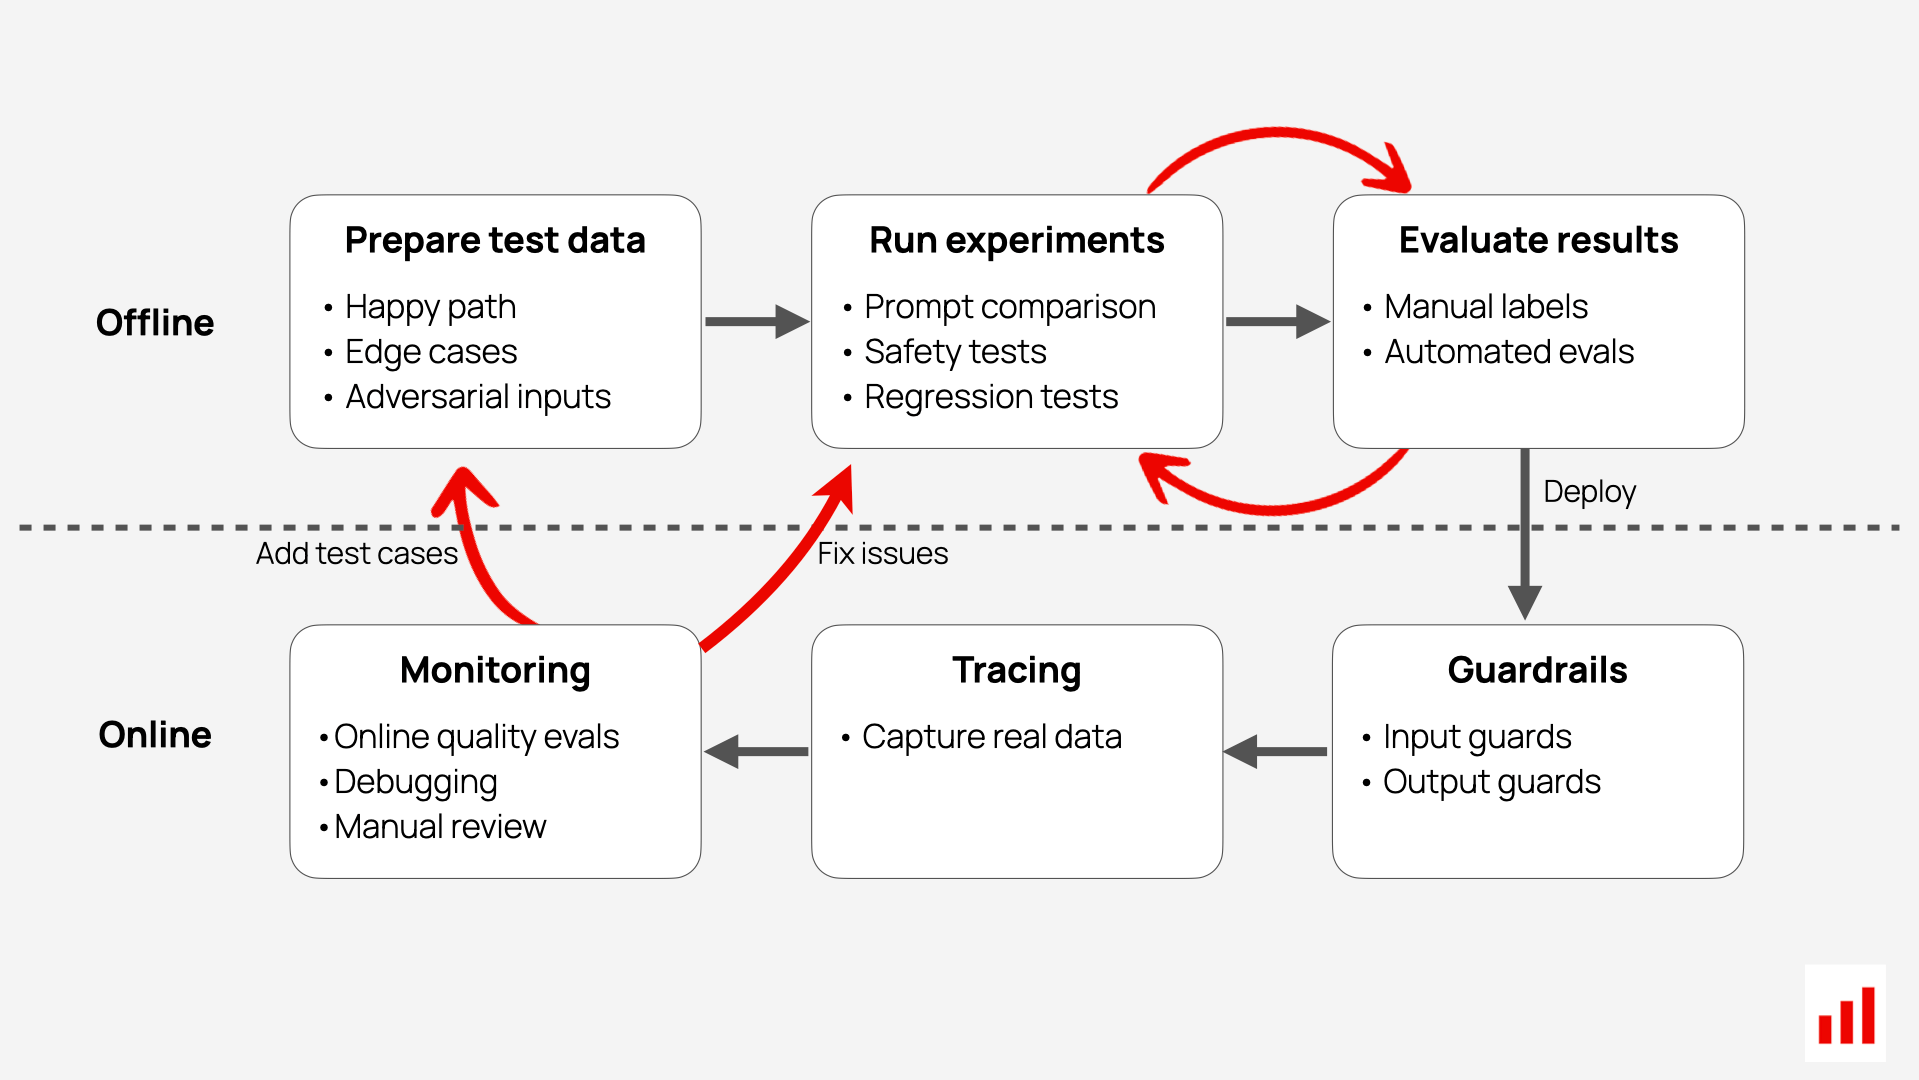
One of the most powerful practices is curating and maintaining a high-quality test dataset. This is not a one-time step. You should continuously update your test set with new examples from production — including bugs, regressions, edge cases, or tasks where performance is critical. With such a dataset, you can confidently evaluate changes like prompt updates or new model versions. Without it, even small changes feel risky, and the system becomes fragile and hard to evolve.
Capturing representative logs is also critical. Real user interactions reflect how people actually use your system — not just idealized examples. These logs help surface failure patterns, recurring topics, or intent mismatches. When captured in a structured way, they can later be used for training, fine-tuning, or testing.
Error analysis is an essential part of the loop. By analyzing logs, evaluations, and user feedback, you can identify common breakdowns. For instance, if users consistently ask questions about a particular topic and the system replies incorrectly or vaguely, that suggests a gap in knowledge or prompt design. In such cases, you might:
- Introduce new knowledge sources or retrieval content
- Modify your prompts or workflow to handle specific questions correctly
- Create targeted evaluation prompts using an LLM-as-Judge to capture specific failure modes to see if you are improving over time
Manual labels should never be wasted. When you label outputs manually — especially for sensitive use cases or corner cases — you can reuse these examples to improve your automatic evaluations. For instance, you can use them to refine your LLM judge prompts or even train a narrow ML classifier. Over time, once you’ve collected enough evaluation data, you may fine-tune your own small model to automate specific evaluations. This gives you faster and cheaper scoring for frequent quality checks.